
If you have ever pressed a damp meter against a wall and seen a scary number flash up, you are not alone. Moisture meters are useful tools, but they are not a standalone “damp diagnosis machine”. Used properly, they help you map moisture patterns, compare areas, and decide whether you need deeper investigation. Used badly, they can push you into unnecessary work, or miss the real cause.
Industry guidance is clear on this: moisture meters are part of a wider damp investigation, not the whole investigation. The Property Care Association (PCA) publishes specific guidance on using moisture meters in damp diagnosis, including when to use laboratory methods like gravimetric testing described in BRE Digest 245.
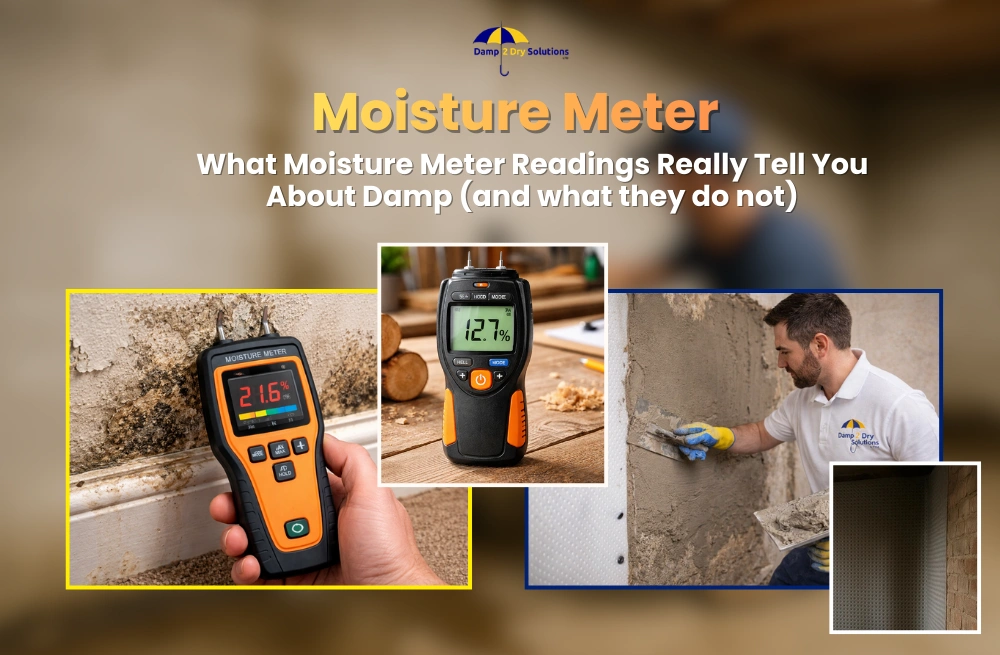
What is your meter actually measuring?
Most handheld meters do not “see water” directly. They measure how the material responds to an electrical signal.
- Pin meters (resistance / conductivity) push a small current between pins. Higher conductivity usually means more moisture, but conductivity also rises if there are salts, certain plasters, contamination, or metal in the path.
- Pinless meters (capacitance / RF scanning) read changes in an electromagnetic field. They are great for fast scanning and pattern mapping, but they are sensitive to density changes, foil-backed boards, metal beads, pipework, and depth differences.
This is why two different meters can read very differently on the same wall, and still both be “right” for what they measure.
The three common scales that confuse homeowners
Before you interpret any number, identify which scale your meter is using:
| What you see on the meter | What it means | Where it is meaningful |
| %MC (moisture content) | A true moisture content percentage (by mass) | Timber, when used correctly |
| WME (wood moisture equivalent) | “This masonry behaves electrically like wood at X% moisture” | Walls, but as a comparative indicator |
| Relative / index (REL, 0–100, 0–999, bars) | A relative dampness index | Pattern mapping only |
The PCA notes that moisture meters can support diagnosis, but for accurate moisture content in masonry, you need methods such as gravimetric testing, as described in BRE Digest 245.
“What reading is acceptable?” The answer depends on what you are testing
1) Timber: numbers matter more
Timber is where meters are most reliable, because many are calibrated to wood.
- Below ~16% MC is generally comfortable for internal timber in normal living conditions.
- Sustained 20%+ MC increases the risk of fungal decay and timber deterioration, especially in cold, stagnant conditions.
A single 20% reading is not an emergency. A timber joist sitting at 20% or higher over time, in a poorly ventilated void, is a different story.
2) Plaster and masonry: treat readings as relative (qualitative), not “percent water”
On plaster and brick, the meter is usually not calibrated for the material. Even the PCA guidance highlights the importance of understanding limitations and using appropriate methods when true moisture content is needed.
So instead of obsessing over one number, focus on:
- How that spot compares with a “likely dry” baseline in the same room
- Whether the pattern makes sense for a plausible moisture source
- Whether readings are stable, rising, or falling over weeks
A practical interpretation framework that surveyors use
If you want readings you can trust, use this four-step workflow.
Step 1: Set a baseline (your control reading)
Pick a likely dry internal wall (away from external walls, chimneys, bathrooms, radiators, and plumbing runs). Take 3–5 readings and note the average. This becomes your reference point for that room.
Step 2: Map the wall, do not chase a single hot spot
- Scan in a rough grid:
- Skirting level (low)
- About 300 mm up
- Mid-wall
- Higher up (where relevant)
You are looking for shapes, not peaks.
Step 3: Profile the suspect area
Once you find a suspect zone, profile it deliberately:
- Vertical line readings (floor to 1.2 m)
- Horizontal line readings (across the patch)
- Profiling is one of the best uses of electronic meters in damp diagnosis.
Step 4: Explain the pattern in plain English
Ask: “If this is moisture, where is it likely coming from, and why does it spread like this?”
That step forces you to check construction details (guttering, roof junctions, ground levels, ventilation) instead of jumping to “rising damp” by default.
What patterns usually suggest (real-world reading logic)
These are not absolute rules, but they are strong starting points.
Rising damp style patterns (not proof, but a reason to investigate)
- Higher readings near floor level
- Readings taper off with height
- Associated symptoms: salt deposits, crumbling plaster, skirting damage, “tide marks”
- Risk factors: bridged DPC, high external ground levels, blocked air bricks, failed drainage
For definitive rising damp diagnosis, industry guidance points towards robust methods like those referenced in BRE Digest 245, rather than relying on surface meter readings alone.
Penetrating damp style patterns
- Higher readings on an external-facing wall
- Localised patch that worsens after rainfall
- Often linked to a defect: failed pointing, cracked render, damaged guttering/downpipe, faulty flashing
Condensation style patterns
- Readings influenced by time of day and heating
- Cold corners, behind furniture, north-facing walls
- Mould growth, but often without classic salt banding
- Ventilation and humidity context matters (BS 5250 is frequently referenced as the UK code of practice for moisture management and condensation risk).
Plumbing leaks
- A tight cluster of high readings near a bathroom, radiator, or pipe route
- Patterns that grow steadily regardless of weather
- Timber nearby often shows elevated MC
Common false highs that catch people out
Moisture meters can over-read for reasons that are not “active damp”.
1) Hygroscopic salts (the big one)
Salts left behind from historic leaks or long-term damp can attract moisture from the air and increase conductivity. That pushes readings up even when there is limited free water. PCA guidance explicitly discusses the role of salts and the use of lab methods to separate moisture sources.
Sanity check: Does the area read “high” all year, with little change after repairs and drying conditions? Is there powdery white deposit or recurring staining?
2) Chimney breasts and old flues
Chimneys are colder, can hold salts, and often suffer from rain ingress at the top. They frequently show persistent “damp” meter behaviour without it being classic rising damp.
3) Foil-backed plasterboard, vapour layers, metal corner beads
Pinless meters especially can spike over foil, and both meter types can spike over metal.
Sanity check: Move 150–300 mm away from edges, sockets, radiators, and corners and retest. If the reading collapses suddenly, suspect interference rather than uniform damp.
4) Fresh plaster, screeds, cleaning, recent decorating
New wet trades can take weeks or months to dry depending on temperature, ventilation, and wall type.
Sanity check: Trend readings weekly. A drying curve is a different story from a stable high.
How to take readings properly (so you can actually use them)
Use this quick checklist:
- Use the same meter, same mode every time
- Measure at the same time of day if you are trend-monitoring
- Avoid known interference zones (metal, foil-backed finishes, pipe routes) until you have a baseline map
- Record conditions (weather, heating on/off, windows open, dehumidifier used)
- Photograph and log readings so you can compare over time
A single reading is weak evidence. A documented pattern over 2–4 weeks is far more informative.
When a moisture meter is not enough
If decisions are expensive (major replastering, damp proof course work, tanking, floor finishes), you want higher confidence than a surface electrical reading.
Consider further testing when:
- Readings remain high despite repairs and drying conditions
- There is a dispute (sale, landlord-tenant, insurance)
- You suspect salts are driving the readings
- You need true moisture content in masonry
The PCA guidance references methods including gravimetric testing (linked to BRE Digest 245) and chemical methods (carbide / “Speedy”) as more appropriate approaches for quantifying moisture in masonry.
What “good” looks like in a survey report
If you are hiring a damp specialist, their report should not just say “30% damp”. It should clearly state:
- The meter make/model and scale used
- The material tested (timber vs plaster vs brick)
- Control/baseline readings used for comparison
- A moisture map/profile showing distribution
- The hypothesis (condensation vs penetration vs leak vs ground moisture)
- What evidence supports it (visual signs, defects, ventilation context)
- Any limitations and what further tests would materially improve certainty
That is what structured, evidence-led diagnosis looks like, and it aligns with how the PCA frames damp investigation as a process rather than a single reading.
FAQs
Can I trust a cheap DIY damp meter?
You can trust it as a trend tool on the same surface, in the same mode, for comparisons over time. You should not treat it as a definitive measure of “% damp in the wall”, especially on plaster and masonry.
What is a “bad” moisture reading for walls?
On walls, “bad” usually means “high compared with your baseline, persistent, and supported by symptoms”. If you want a number, treat it as a trigger for investigation rather than a diagnosis. Industry guidance emphasises context, and points to more robust methods when true moisture content must be known.
Why does my wall read high but look dry?
Most commonly: salts, cold-surface condensation, foil-backed finishes, or metal interference. A moisture map and a few sanity checks usually reveal which one is most likely.
How long should it take for readings to drop after fixing a leak?
It depends on wall construction, plaster type, ventilation, and temperature. Solid walls and chimneys can stay damp for longer. The key is whether readings trend down steadily week to week.
Bottom line: treat the meter as a map, not a verdict
Moisture meters are best at answering these questions:
- Where is the wall behaving “wetter” than expected?
- What shape does the moisture pattern form?
- Is the area drying down, stable, or worsening over time?
They are not best at answering: “What exact percentage of water is in this plaster wall?”
For that, you move to methods referenced in professional guidance such as BRE Digest 245 and PCA documentation.
Need clarity on your moisture meter readings?
If you are seeing high readings on your walls and are not sure whether it is condensation, penetrating damp, rising damp, or simply salt contamination, the worst thing you can do is guess. A single number on a damp meter is not a diagnosis. What matters is the pattern, the building type, and the wider evidence.
At Damp 2 Dry Solutions, we take a structured, evidence-led approach. We:
- Set clear baseline readings for comparison
- Profile and map moisture properly
- Distinguish between true damp and false highs
- Explain findings in plain English
- Recommend proportionate, long-term solutions
We carry out independent damp surveys across Cheshire, Manchester & Lancashire, Liverpool & Merseyside, Stoke-on-Trent, Warrington, Chester and Newcastle.
If you would like clarity before committing to costly damp proofing work, book a professional damp survey and get answers you can rely on.